Description
Wright battery pack test equipment adopts advanced IGBT circuit control technology and high-performance power quality control technology to realize bidirectional flow of energy, high power factor of electric energy, low harmonic level feedback, and combines DSP digital processing technology and high-precision sampling Control technology, cooperate with the software platform to complete the high-speed dynamic response, accurate current and voltage detection, complete data acquisition and processing functions in the whole test process, the Wright battery pack test equipment has the characteristics of high efficiency, energy saving, no pollution to the power grid, etc. The research and production provide a safe and reliable guarantee.
1. System overview
Wright battery pack test equipment has excellent performance and a wide test platform, which can perform specific mode charging, discharging and battery pack capacity, DC internal resistance, life and other tests on battery modules or battery packs. Comprehensive testing of various electrical properties of power batteries of different specifications can comprehensively evaluate the quality of power batteries; and check and screen the consistency of products before leaving the factory.Wright battery pack test equipmentUsing advanced IGBT circuit control technology and high-performance power quality control technology to achieve bidirectional flow of energy and high power factor of electric energy, low harmonic level feedback, and combined with DSP digital processing technology and high-precision sampling control technology, with software The platform can complete the high-speed dynamic response, accurate current and voltage detection, complete data acquisition and processing functions in the whole test process,Wright battery pack test equipmentIt has the characteristics of high efficiency, energy saving, and no pollution to the power grid, which provides a safe and reliable guarantee for the research and production of power batteries.
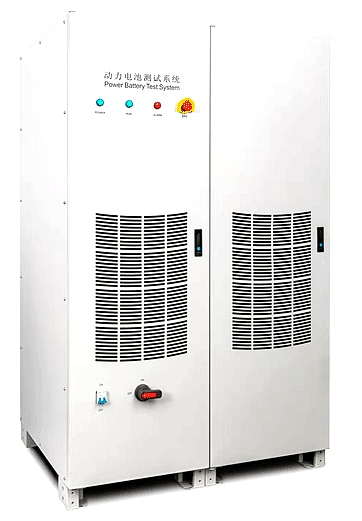
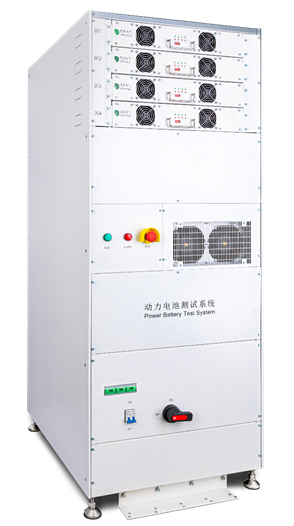
1.1Equipment specifications and models and reference appearance drawings
device name | Voltage measurement range | Current measurement range | Equipment size Width, depth and height (mm) | Weight (approx.) | Current and voltage beyond can be customized |
Battery pack test equipment | 100V1600V | 100A2000A | 1450mm850mm1950mm | 800Kg |
1.2System schematic
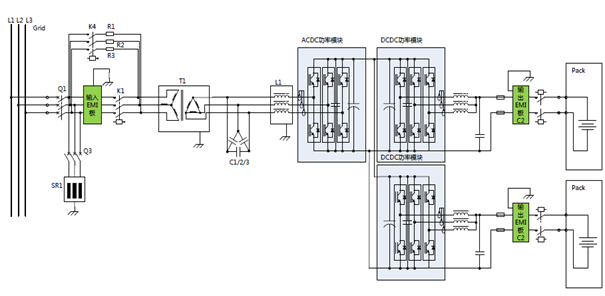
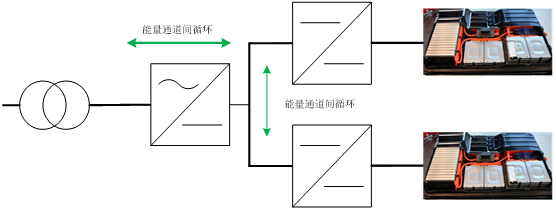
System topologyThe vector digital control technology based on SVPWM is used to realize the bidirectional flow of energy between the power grid and the battery, and at the same time to achieve high power factor and low harmonic. Precision and fast dynamic switching.
1.3Wright battery pack test equipmentFeatures
1.3.1Modular, high charging and discharging efficiency, high energy feedback efficiency
The charging efficiency can be as high as 96%, and the discharge feedback efficiency can be as high as 95%, so as to save a lot of energy consumption, and reduce a lot of heat energy generated during the discharge process, so as to save the air-conditioning electricity bills generated by air-conditioning and refrigeration.Wright battery pack test equipmentIt is a green energy-saving product. The energy of the multi-channel test equipment can be used to charge the batteries of other channels when discharging. It does not pollute the power grid and does not affect other electrical equipment. The power factor is greater than 0.99, and the current harmonics (THDi)<5>
1.3.2Fast response to charge and discharge, no overshoot
The current has no current impact at the moment of turn-on or turn-off and the constant current and constant voltage charging stage, and the current is smooth without overshoot. During the whole charging and discharging process, it has the function of dynamic load protection. The following figures are the current response and current conversion waveforms respectively.
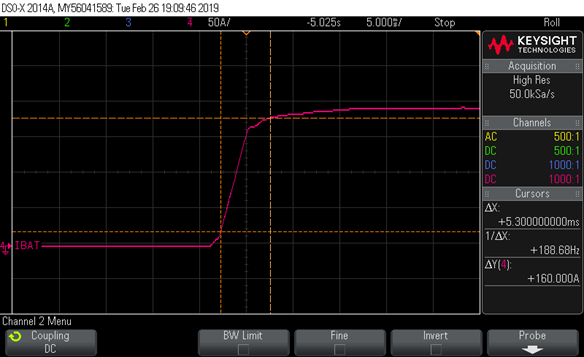
10 percent 90 percent current response waveform (5.3ms)
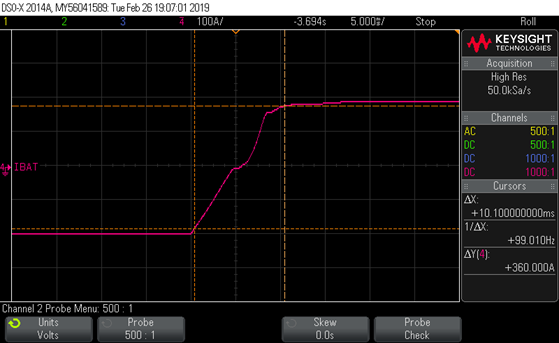
-90 percent plus 90 percent current response waveform (10.1ms)
1.3.3Working condition simulation function
It can convert the actual measured working condition data of the vehicle into a simulated simulation test process, and conduct working condition simulation tests on the power battery pack; provide comprehensive test items, reliable experimental data and professional data analysis for power battery module or PACK manufacturers to help manufacturers. Improve product performance and shorten product development cycles.
1.3.4Convenient and flexible BMS data connection and control
It supports the editing and mapping of DBC files. The system can use the DBC configuration file based on VectorCan's standard protocol to realize data exchange, docking and control with BMS. It has stronger versatility, and customers can set various solutions for battery packs more conveniently and flexibly. At the same time, it ensures that the battery pack test is safer and more reliable. It can connect and control data with BMS of different manufacturers, and each BMS protocol will form a standard DBC file.
1.3.5Current range binning function (optional)
According to the requirements of the national standard GB\/T31467.3 "during the test process, the error between the control value and the target value is less than or equal to ± 1 percent", so the equipment with a basic accuracy of 0.1 percent FS, the accuracy of less than 10 percent of the range>± 1 percent, cannot be Guarantee test accuracy.
For example: Current accuracy: 0.1% FS.500A range current accuracy is ±0.5A, when measuring 50A, ±0.5A\/50A is ±1%, which does not meet the standard and actual use requirements.
In order to improve the accuracy of the full range, the current ranges of the main products launched by Wright Company have optional dual-range or even multi-range modes of large-gear range and small-gear range, and the corresponding range can be selected according to different usage conditions to more accurately protect the battery. Accuracy and quality of detection.
1.3.6Power off function
If the device is powered off suddenly, when the device is turned on next time, the system will automatically connect to the state when the device was powered off last time and continue to run.
1.3.7Offline test function
If the computer crashes, the test will still be carried out automatically and the test data will be saved on the lower computer. After the computer returns to normal, you can continue to monitor the test process without losing the test data.
2, system function introduction
Process steps | Charge | constant current mode, constant voltage mode, constant current and constant voltage mode Constant Power Mode, Ramp Current Mode, Ramp Power Mode Pulse mode, rate mode, working condition simulation mode |
discharge | Constant Current Mode, Constant Resistance Mode Constant Power Mode, Ramp Current Mode, Ramp Power Mode Pulse mode, rate mode, working condition simulation mode | |
DC Internal Resistance Test (DCIR) | Step to achieve one-step test and output the results directly | |
Cycles | The cycle test range is 165535 times, the single cycle step is greater than 254, and the cycle nesting is 3 | |
Deadline | Device channel | total voltage, total current, time, battery internal resistance Charge accumulates Ah, discharge accumulates Ah Charge to accumulate Wh, discharge to accumulate Wh |
BMSaisle | BMSTotal voltage, BMS total current BMSCell voltage, BMS cell voltage difference BMSMonomer temperature, BMS monomer temperature difference BMSTemperature, BMS SOC | |
Monomer auxiliary channel | Cell temperature, cell voltage | |
other | temperature control box temperature, temperature control box humidity | |
data record | test statistics | Ah, Wh,Internal resistance, SOC, Single battery voltage, single battery temperature The largest cell voltage difference, the smallest cell voltage difference |
Test Data record condition | Time interval, Ah, Wh, Current, Voltage, Auxiliary channel cell voltage, Auxiliary channel cell temperature, Cycle times, step switching, temperature control box temperature, temperature control box humidity | |
Minimum recording period | 10ms | |
data analysis | Real-time waveform display | During system operation, the main window of the software will display the current current, voltage, charge and discharge capacity of each channel, the process of running steps and the name of the current running step in real time. |
Test data plot | The test data is drawn as a curve, and the picture is exported | |
Historical data query | The software can also view the current running data or historical record data at any time through the window, and export the data in EXCEL format or txt format first. | |
Protect | input protection | Over voltage, over current, phase loss, short circuit, reverse polarity, over temperature |
output protection | Voltage clamp, over current, over temperature, over voltage, under voltage | |
battery protection | Voltage lower limit, voltage upper limit, current lower limit, current upper limit | |
Monomer protection | Cell undervoltage, cell overvoltage, cell temperature overrun, battery reverse connection, overrange protection alarm, and the protection limit can be set. | |
Power-off protection | After the external power failure, the battery and the device are automatically disconnected, which can effectively avoid accidents caused by re-powering, and save the breakpoint data at the same time, and the process operation can be continued after the power is turned on; | |
Emergency stop protection | emergency button Power out of the box | |
3rd Party Device Extensions | Software interface supports third-party device access | |
3, equipment parameters
Indicator item | index parameter | |
Input AC power | Built-in isolation transformer, input voltage | 380Vac(342Vac437Vac) |
main road | power component | IGBT:Infineon |
Charge and discharge output voltage range (Vdc) | 10V-750V | |
Number of output channels | 1 | |
Single channel output current range | -160A- Plus 160A | |
single channel output power | 120kW | |
Voltage measurement and control accuracy | 0.05 percent FS±0.05 percent RD | |
Voltage acquisition resolution | 16bit | |
Current measurement and control accuracy | 0.05 percent FS±0.05 percent RD | |
Current acquisition resolution | 16bit | |
Current Rise\/Fall Time (10% 90% FS) | <> | |
Charge-discharge transition time (-90 percent plus 90 percent FS) | <> | |
Protective function | Grid side protection | Undervoltage, overvoltage, overcurrent, short circuit, phase loss protection alarm |
battery side protection | Undervoltage, overvoltage, overcurrent, short circuit, reverse polarity protection alarm | |
Power Quality | power factor | 0.99 |
current harmonics | <5> | |
Overall equipment efficiency | >80 percent | |
environmental conditions | Altitude | 3000m |
ambient temperature | 045Celsius | |
maximum relative humidity | 095 percent(no condensation) | |
equipment noise | <> | |
Protection class | IP20 | |
cooling method | air cooling | |
Mechanical parameters | Dimensions (width, depth and height) | 1600mm850mm1950mm |
weight | about 800kg |
4, software introduction
The host computer test software is an integral part of the charge and discharge test system. The Wright host computer test software can be installed on Windows7 and above professional computers to realize integrated services of process program, test process, data acquisition and result analysis; the test software is user-friendly , Integrated design concept, easy for users to operate; using mature software design architecture, with good scalability, easy to upgrade and maintain.
1, craft editor
The user can set the process flow according to the characteristics of the battery, and can also save the test template for future calls, and can also modify the working parameters during the operation of the step.

2,data analysis
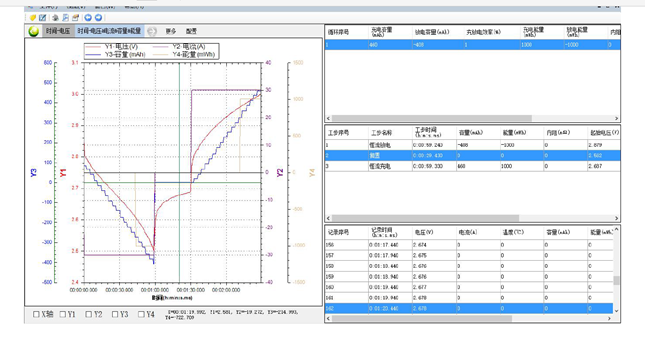
Users can customize the content of X-axis and Y-axis for data comparison and analysis, and support 4 curve data at the same time. After selecting the content of the curve, the corresponding color can be configured in the list, the curve can be scaled and moved arbitrarily, and double-click in the data table at the same time. The data can be mapped to the data points on the curve. The green vertical line in the figure.
3,Data output
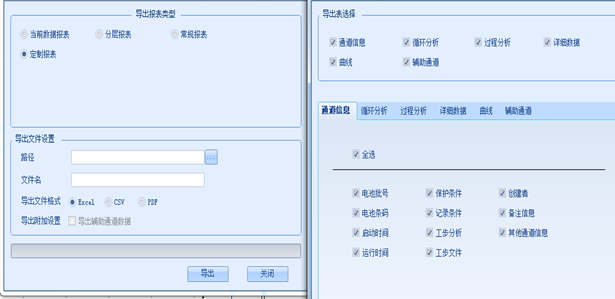
Data and curve processing: the system can directly export data to CSV, EXCEL, or directly save the curve as a picture; in addition, users can customize the list display items according to their needs, including cycle data, process data and detailed data, which can be customized to export file name.
